- Home
- :
- All Communities
- :
- Industries
- :
- Education
- :
- Education Blog
- :
- Mapping Hometowns in ArcGIS Online from Shared Doc...
Mapping Hometowns in ArcGIS Online from Shared Documents
- Subscribe to RSS Feed
- Mark as New
- Mark as Read
- Bookmark
- Subscribe
- Printer Friendly Page
- Report Inappropriate Content
You know the drill: You're in a course or a workshop, and one of the first things the instructor does to encourage community building is to "go around the room" (or if online, as a discussion topic), have people introduce themselves, explain their background, and discuss their goals are in taking the course. I turned this tried-and-true activity into a mapping activity numerous times by mapping a few of the things people share about themselves. I do this simply by asking course participants to add their information to a shared spreadsheet, and then mapping the results in ArcGIS Online. After having used this activity with students from primary school through university level, and with faculty covering those same levels, I can confirm that this activity sparks discussion about citizen science, data quality, how to map tabular data, ways to symbolize and classify mapped data, but in particular, how fast and easy it is to make a map! The spatial patterns are immediately evident, and you can use the opportunity to discuss the other kinds of information that can be mapped, including weather, tree species, noise, pedestrian counts, trash, water quality, and much more.
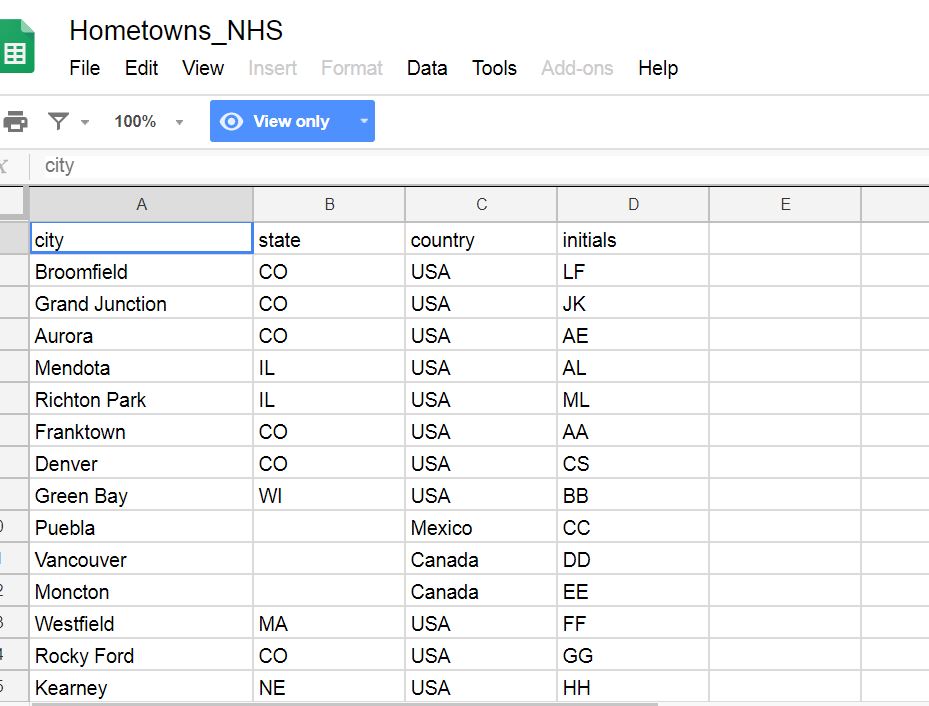
As the instructor, you should set up the spreadsheet and make sure it is shared so that your course participants can add their information to it. My sample spreadsheet with some data including points in Canada and Mexico to demonstrate that the geoc.... I used Google Drive but other file sharing services such as OneDrive or Dropbox will work. Notice that the first row in the spreadsheet contains the field names city, state, country items that will be used to map the data. While you can use street address or latitude-longitude, I don't advise doing this for location privacy reasons. Keep it simple and effective with city/country names, as shown below.
Instead of initials, you could ask the participants to make up a nickname for themselves--just remember to keep location privacy in mind. Or, leave off the initials and insert other data, particularly numeric data, that you could map as graduated color or graduated symbol, such as "how many times did you eat out last week?" or, "how many times have you been swimming in the past year?" or "how many countries have you visited in your lifetime?"
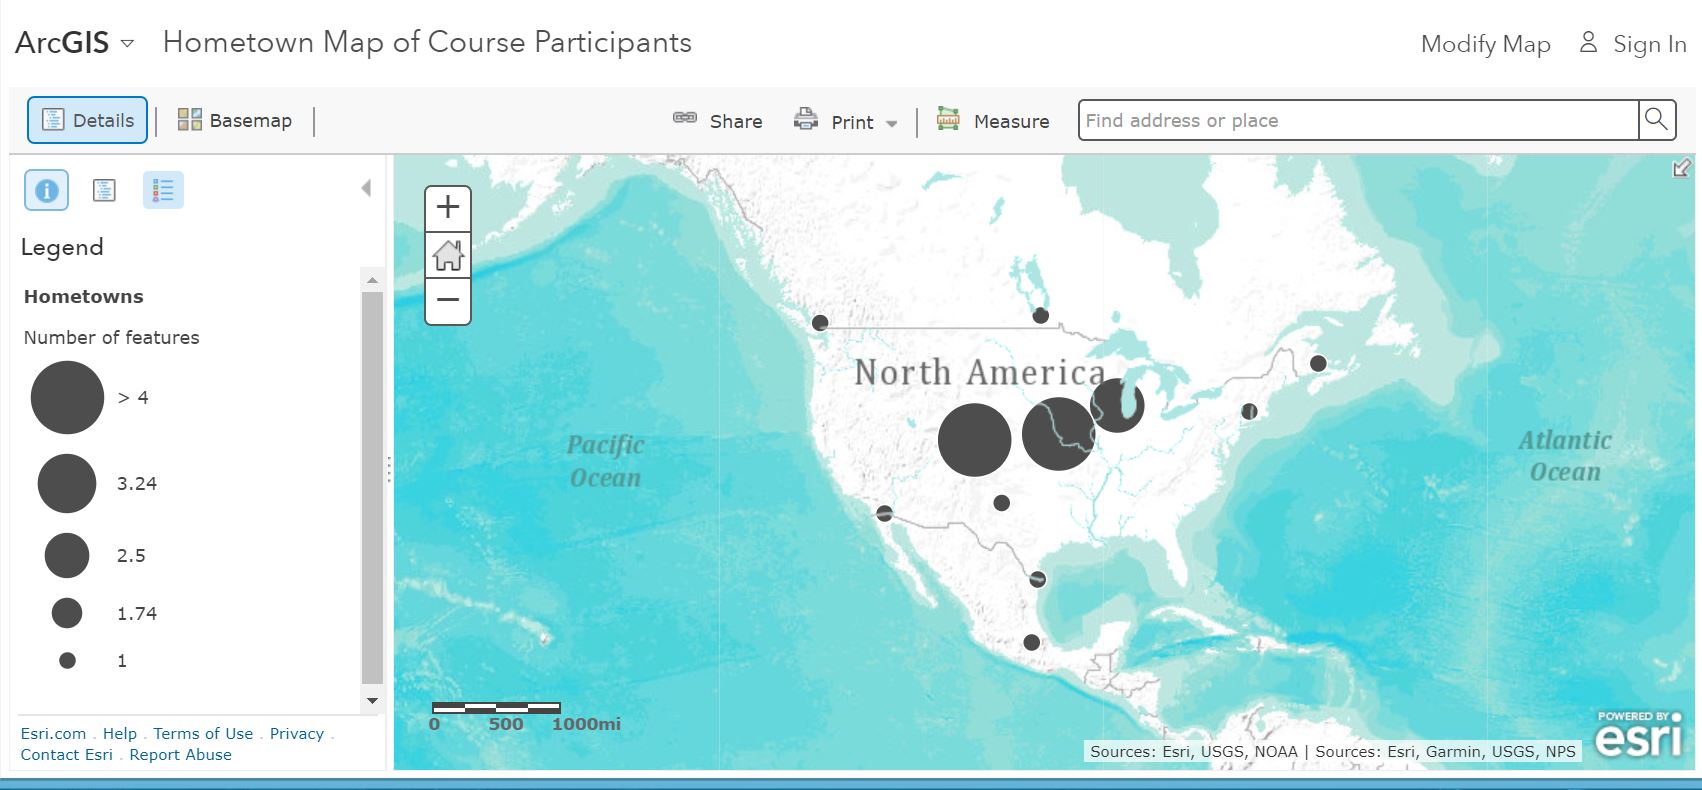
Next, with a projector so that the course participants can see what you are doing, go to your spreadsheet, save it to the web as a CSV (comma separated value) file, then go to ArcGIS Online > Modify Map > Add Data > Add from web – CSV – point to the your CSV file, and indicate which fields contain city, state, and country. Save and share the map. Symbolize the result in different ways, by initials, hometown name, or as a heat map. Change the classification method and observe the differences. Change the base map, label the features, and change the default popup. The result is shown here, with the clustering utility turned on.
If you have time on the same day or in subsequent days in your course, I encourage you and your course participants to dig deeper--try one or two of the many ways that exist in which to make a web mapping application, such as a story map, from the original map, or add a photograph of each of the hometowns to the data to practice your linking skills.
Don't have time or access to shared areas such as Google Drive? No problem--simply build a spreadsheet in Excel (or even in Notepad or other text editor, using commas to separate the fields) in front of your students based on their input as they are speaking, and then use "Add Data from File" in ArcGIS Online to map it.
For more information, see my video explaining these procedures, step-by-step, this essay I wrote on participatory mapping, and other related education essays in this GeoNet space.
Have you tried this activity or something related? I look forward to hearing your comments.
You must be a registered user to add a comment. If you've already registered, sign in. Otherwise, register and sign in.
-
Administration
38 -
Announcements
44 -
Career & Tech Ed
1 -
Curriculum-Learning Resources
178 -
Education Facilities
24 -
Events
47 -
GeoInquiries
1 -
Higher Education
518 -
Informal Education
265 -
Licensing Best Practices
46 -
National Geographic MapMaker
10 -
Pedagogy and Education Theory
187 -
Schools (K - 12)
282 -
Schools (K-12)
184 -
Spatial data
24 -
STEM
3 -
Students - Higher Education
231 -
Students - K-12 Schools
85 -
Success Stories
22 -
TeacherDesk
1 -
Tech Tips
83
- « Previous
- Next »