- Home
- :
- All Communities
- :
- Industries
- :
- Education
- :
- Education Blog
- :
- Touchdown! Teaching Spatial Thinking and Web GIS ...
Touchdown! Teaching Spatial Thinking and Web GIS with Football Map
- Subscribe to RSS Feed
- Mark as New
- Mark as Read
- Bookmark
- Subscribe
- Printer Friendly Page
- Report Inappropriate Content
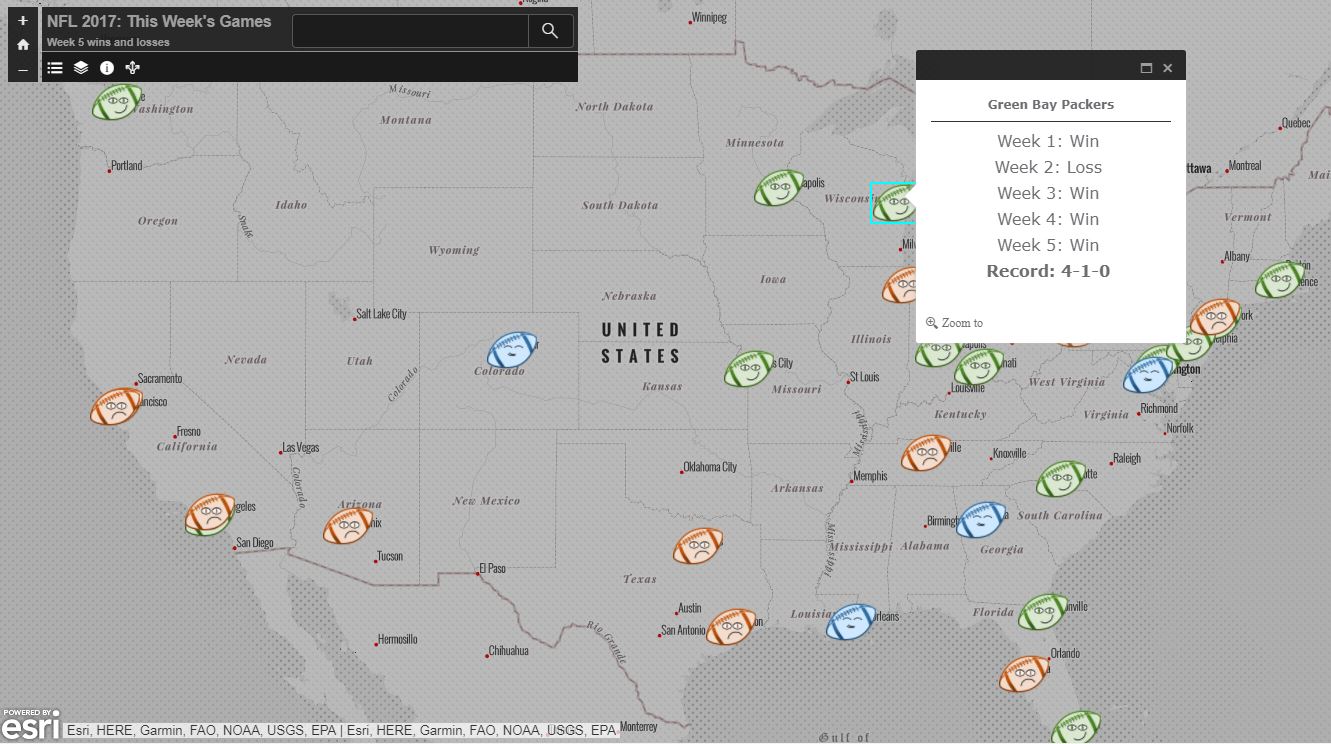
Here is a fun and interactive map (full URL here) that you could use to teach spatial thinking and Web GIS fundamentals. This map shows the results of NFL (National Football League) football week-by-week data. Why are the team locations distributed as they are? How does the spatial pattern of football teams compare to those of professional basketball, hockey, or baseball? How has the spatial pattern of the football teams changed recently and how will it change in the future, and why? (recent moves of teams to Los Angeles and an impending move to Las Vegas). Use ArcGIS Online to investigate city size. What seems to be the minimum size threshold for a city to have an NFL team? What large cities do not have an NFL team, and why? (Birmingham Alabama, Portland Oregon, or Memphis Tennessee, for example). What is an example of a smaller city that has an NFL team? (Green Bay, Wisconsin).
You can also explore this map to illustrate how the Esri Web AppBuilder, the storymaps builder, and other tools can be used to create interactive web mapping applications in ArcGIS Online. Examine how animated GIFs can be used in the creation of web maps - in this case, the sleepy, happy, and sad football faces depend on the team’s results for the previous week.
For the GIS professionals reading this, you could show this map to your friends and family to introduce them to the idea of web mapping applications and what GIS is. You could also show this as your attention-getting starting point if you are visiting a school as a geomentor (http://geomentors.net) or for something to demonstrate on GIS Day (www.gisday.com).
The map is updated after each Monday Night game (and thus the map after Week 6 below will unfortunately show the sad faces in Green Bay and Denver).
For more information, see my video with further details. If you would like to further pursue the connections between sports and geotechnologies, see the chapter on geotechnologies that Jill Clark and I wrote in the book Practical Sports Coaching by Christine Nash.
You must be a registered user to add a comment. If you've already registered, sign in. Otherwise, register and sign in.
-
Administration
38 -
Announcements
45 -
Career & Tech Ed
1 -
Curriculum-Learning Resources
179 -
Education Facilities
24 -
Events
47 -
GeoInquiries
1 -
Higher Education
519 -
Informal Education
266 -
Licensing Best Practices
46 -
National Geographic MapMaker
11 -
Pedagogy and Education Theory
187 -
Schools (K - 12)
282 -
Schools (K-12)
185 -
Spatial data
24 -
STEM
3 -
Students - Higher Education
231 -
Students - K-12 Schools
86 -
Success Stories
22 -
TeacherDesk
1 -
Tech Tips
83
- « Previous
- Next »