Turn on suggestions
Auto-suggest helps you quickly narrow down your search results by suggesting possible matches as you type.
Cancel
- Home
- :
- All Communities
- :
- Industries
- :
- Education
- :
- Education Blog
- :
- Using ArcGIS Online to Analyze the Toxic Spill in ...
Using ArcGIS Online to Analyze the Toxic Spill in Hungary
Subscribe
353
0
06-29-2017 12:39 AM
- Subscribe to RSS Feed
- Mark as New
- Mark as Read
- Bookmark
- Subscribe
- Printer Friendly Page
- Report Inappropriate Content
06-29-2017
12:39 AM
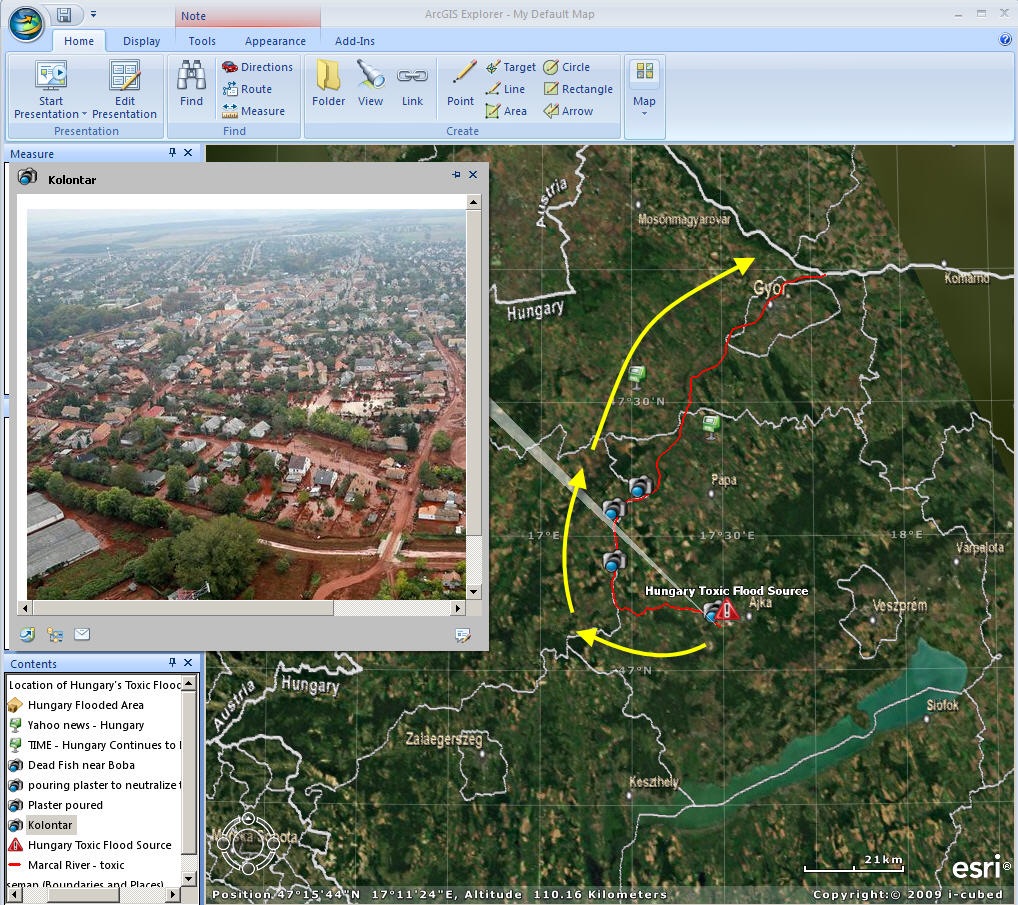
A reservoir at an alumina factory in Hungary burst in early October 2010, causing a toxic torrent of water to flow through three villages and creeks. People and fish died; livelihoods were destroyed. Yet from a spatial perspective, we all know that the problem did not end with those three villages and creeks. The water had to flow somewhere. But where?
A quick search on ArcGIS Online (http://www.arcgis.com) uncovered a pertinent layer. I opened this layer and found a series of news articles, photographs, and videos linked to the locations where they were recorded on the ground. Analyzing the spill in a GIS environment allowed me to make sense of the scale, landforms, population, and watersheds affected by the disaster. Suddenly, I had a spatial context and perspective that reading disconnected news stories did not provide. ArcGIS Explorer allows you to navigate the landscape in a 3-D environment, changing the base map in order to examine nearby towns, lakes, and ultimately, how the spill reached the Danube, one of the most important rivers in Europe. Like paper maps have allowed us to do for centuries, a GIS helped me to understand, and to tell a story to others. And like most geographic phenomena, I can examine this in other disciplines—for example, in biology to understand the importance of pH, in economics to analyze the importance of alumina, and in mathematics to calculate the distance and time of sediment transport.
As explained in GIM International, hyperspectral and Lidar imagery was collected and used in a GIS and remote sensing environment to model scenarios and to detect future damage to dams. This article points to the critical role that geotechnologies have in every disaster that occurs nowadays to help policymakers and residents in the decisions they have to make.
Another thing to turn into a teachable moment is an observation that struck me in searching for news about the disaster. Almost every news story was published in the first week of the disaster, with almost nothing since then. Recognizing that news is a business and that to sell it, it has to be current, I was sad to consider that this event held the world’s attention for only a brief time, yet the local residents are still dealing with the effects on a daily basis and may continue to do so for years. What are the temporal and geographic aspects to human-environment interactions?
How can you make use of ArcGIS Online to analyze current events?
-Joseph Kerski, Esri Education Manager
You must be a registered user to add a comment. If you've already registered, sign in. Otherwise, register and sign in.
About the Author
I believe that spatial thinking can transform education and society through the application of Geographic Information Systems for instruction, research, administration, and policy.
I hold 3 degrees in Geography, have served at NOAA, the US Census Bureau, and USGS as a cartographer and geographer, and teach a variety of F2F (Face to Face) (including T3G) and online courses. I have authored a variety of books and textbooks about the environment, STEM, GIS, and education. These include "Interpreting Our World", "Essentials of the Environment", "Tribal GIS", "The GIS Guide to Public Domain Data", "International Perspectives on Teaching and Learning with GIS In Secondary Education", "Spatial Mathematics" and others. I write for 2 blogs, 2 monthly podcasts, and a variety of journals, and have created over 5,000 videos on the Our Earth YouTube channel.
Yet, as time passes, the more I realize my own limitations and that this is a lifelong learning endeavor and thus I actively seek mentors and collaborators.
Labels
-
Administration
38 -
Announcements
45 -
Career & Tech Ed
1 -
Curriculum-Learning Resources
179 -
Education Facilities
24 -
Events
47 -
GeoInquiries
1 -
Higher Education
519 -
Informal Education
266 -
Licensing Best Practices
46 -
National Geographic MapMaker
17 -
Pedagogy and Education Theory
187 -
Schools (K - 12)
282 -
Schools (K-12)
185 -
Spatial data
24 -
STEM
3 -
Students - Higher Education
231 -
Students - K-12 Schools
86 -
Success Stories
22 -
TeacherDesk
1 -
Tech Tips
83
- « Previous
- Next »