Turn on suggestions
Auto-suggest helps you quickly narrow down your search results by suggesting possible matches as you type.
Cancel
- Home
- :
- All Communities
- :
- Industries
- :
- Education
- :
- Education Blog
- :
- Examining Current Steamflow Conditions in ArcGIS O...
Examining Current Steamflow Conditions in ArcGIS Online
Subscribe
164
0
06-29-2017 12:27 AM
- Subscribe to RSS Feed
- Mark as New
- Mark as Read
- Bookmark
- Subscribe
- Printer Friendly Page
- Report Inappropriate Content
06-29-2017
12:27 AM
One of the consistently valuable concepts in inquiry-based education is cause-and-effect. GIS is an excellent tool to illustrate cause and effect because phenomena on our dynamic planet occur at different scales and over different time periods, and thus can be examined spatially. One of the very first scientific monitoring networks to go online was the data from USGS stream gaging stations. I remember looking up some of these reports on microfiche when I first started working at the USGS in 1989; the data was valuable but already “historical” by the time it was published. Today, ArcGIS Online provides the ability to analyze how current and recent weather affect streamflow in real time.
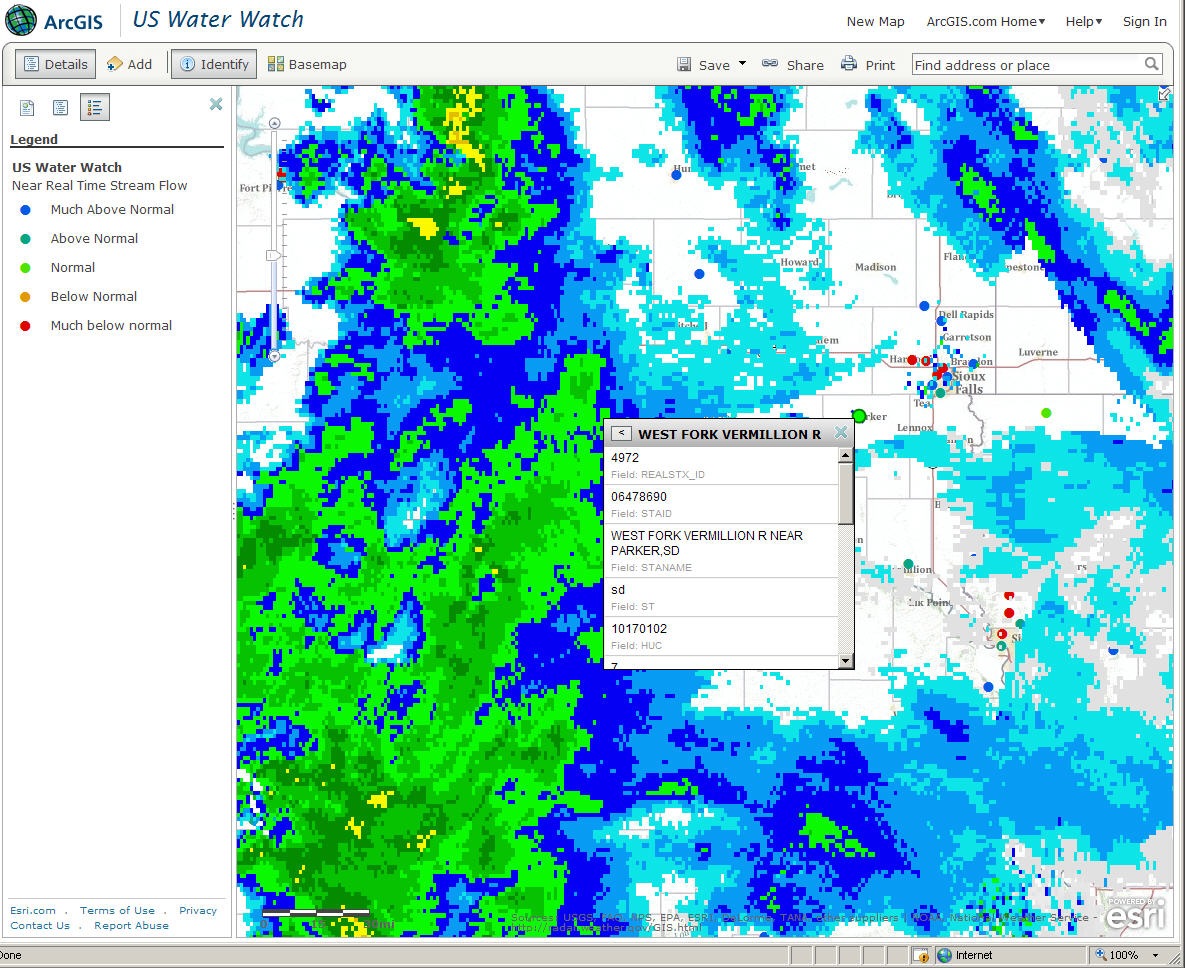
To do this, visit ArcGIS Online and do a search on “water watch.” Open the US Water Watch in ArcGIS Online in your web browser. You can select from thousands of gaging stations that are broadcasting current flow conditions, including some with real-time data on several water quality variables. I searched and added “US Current Radar” and today I see that the upper Midwest is experiencing some significant areas of precipitation. How does this impact river conditions in the area? I identified a gaging station on the West Fork of the Vermillion River near Parker, South Dakota, station 06478690, and pulled up its information, below.
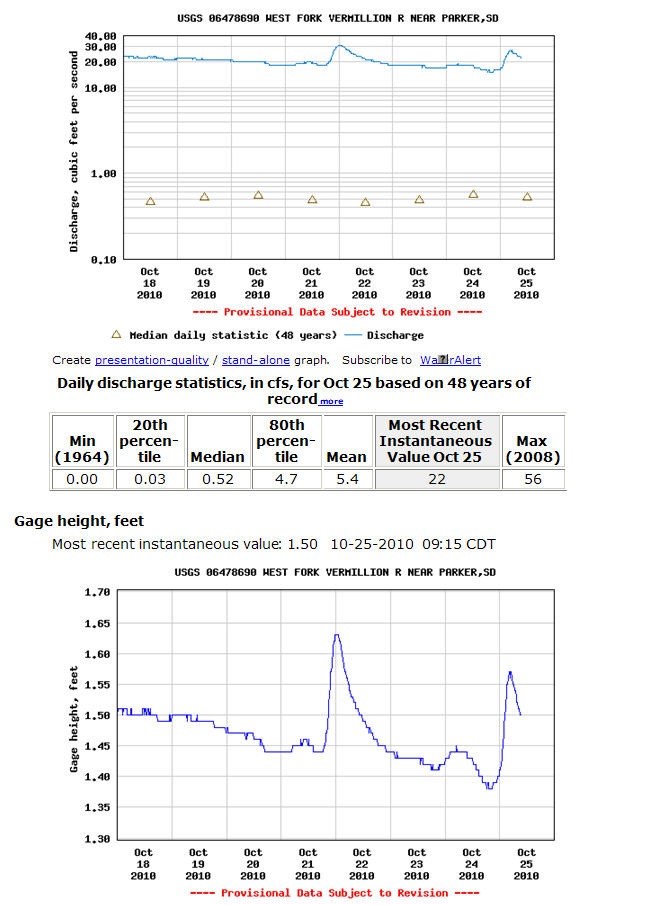
The identify window allows me to examine hydrographs and tabular data for the stream gage at this location. It reveals that the river is running at over 20 cubic feet per second, far above the mean of 0.7 cubic feet per second. The gate height of 1.5 feet in the lower graph helps students understand how much water this represents. They could wade across the river at this height, although caution near rivers is always a good idea. Students examining other rivers running over 20 times their normal discharge will find that it would be impossible to wade across many of these rivers.
What other phenomena influence streamflow? How could you ask students to uncover the relationship of snowmelt, floods, or hurricanes to streamflow using ArcGIS Online?
- Joseph Kerski, Esri Education Manager
You must be a registered user to add a comment. If you've already registered, sign in. Otherwise, register and sign in.
About the Author
I believe that spatial thinking can transform education and society through the application of Geographic Information Systems for instruction, research, administration, and policy.
I hold 3 degrees in Geography, have served at NOAA, the US Census Bureau, and USGS as a cartographer and geographer, and teach a variety of F2F (Face to Face) (including T3G) and online courses. I have authored a variety of books and textbooks about the environment, STEM, GIS, and education. These include "Interpreting Our World", "Essentials of the Environment", "Tribal GIS", "The GIS Guide to Public Domain Data", "International Perspectives on Teaching and Learning with GIS In Secondary Education", "Spatial Mathematics" and others. I write for 2 blogs, 2 monthly podcasts, and a variety of journals, and have created over 5,000 videos on the Our Earth YouTube channel.
Yet, as time passes, the more I realize my own limitations and that this is a lifelong learning endeavor and thus I actively seek mentors and collaborators.
Labels
-
Administration
38 -
Announcements
44 -
Career & Tech Ed
1 -
Curriculum-Learning Resources
178 -
Education Facilities
24 -
Events
47 -
GeoInquiries
1 -
Higher Education
518 -
Informal Education
265 -
Licensing Best Practices
46 -
National Geographic MapMaker
10 -
Pedagogy and Education Theory
187 -
Schools (K - 12)
282 -
Schools (K-12)
184 -
Spatial data
24 -
STEM
3 -
Students - Higher Education
231 -
Students - K-12 Schools
85 -
Success Stories
22 -
TeacherDesk
1 -
Tech Tips
83
- « Previous
- Next »