Turn on suggestions
Auto-suggest helps you quickly narrow down your search results by suggesting possible matches as you type.
Cancel
- Home
- :
- All Communities
- :
- Industries
- :
- Education
- :
- Education Blog
- :
- Analyzing the Environment in a GIS with the North ...
Analyzing the Environment in a GIS with the North American Environmental Atlas
Subscribe
505
0
06-29-2017 12:29 AM
- Subscribe to RSS Feed
- Mark as New
- Mark as Read
- Bookmark
- Subscribe
- Printer Friendly Page
- Report Inappropriate Content
06-29-2017
12:29 AM
GIS users are always on the lookout for interesting spatial data. Those who use GIS in education seek data that can be used to teach core concepts in a variety of disciplines. One of the most useful continent-wide spatial data resources is from the North American Environmental Atlas (http://www.cec.org/atlas). It contains data on watersheds, ecoregions, human impact on protected areas, industrial pollution, wetlands, land cover, conservation areas, and base layers including transportation, waterways, and cities. It also contains layers on 17 species of common conservation concern, such as the Burrowing Owl, the Mountain Plover, and the American Black Bear. The atlas was born from collaboration among the national mapping agencies in Canada, the United States, and Mexico, and through the Commission for Environmental Cooperation. Its goal is to provide a foundation to analyze the status of environmental conditions and identify trends across the whole continent.
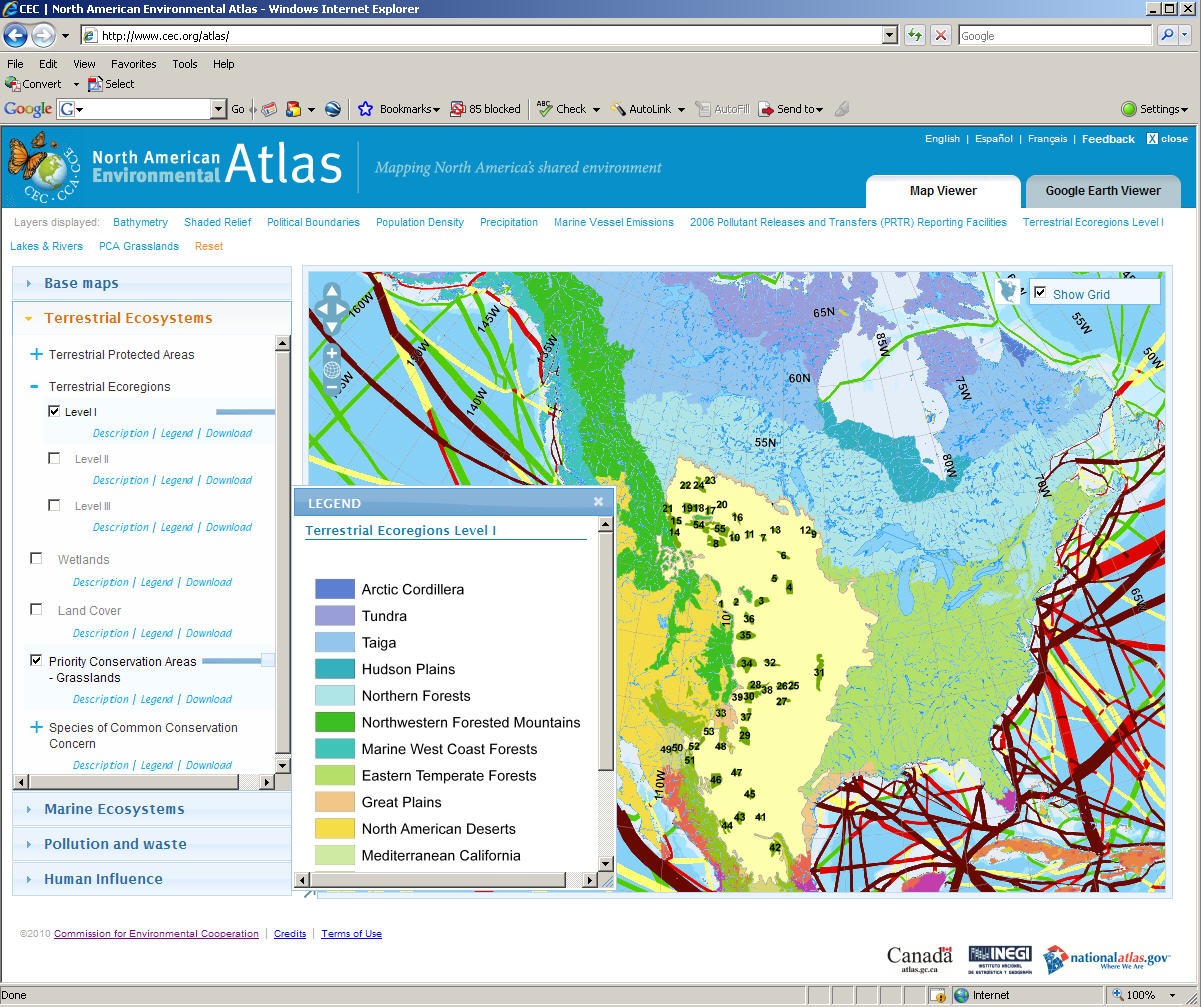
The atlas is useful because of its rich content, the fact that it is comprised of public domain data, and because you can use it in three different ways. First, you may order up to 5 free paper wall-sized maps from the link on the site. Second, the content is offered as a Web GIS, meaning that you can examine the data interactively with just a web browser, made possible by ArcGIS Server running behind the scenes. What is the relationship between grasslands, rainfall, and elevation? Third, the data from the site is offered as downloadable shapefiles, layer packages, and map documents, ready for ArcGIS desktop. Metadata files are readily available and you can use the web GIS viewer for previewing the data before downloading. Why download the data if you can analyze it online? Both methods are valid approaches to helping students think spatially, but by downloading the data and using it inside ArcGIS desktop, you can dig deeper, analyzing the patterns across space, time, and with spatial statistical techniques. For example, you can assess how much burrowing owl habitat is within 10 kilometers of a pollutant release facility. I also like the atlas because it does not ignore the oceans—marine ecoregions, protected areas, and marine vessel emissions are all included.
What types of analysis will you do with the North American Environmental Atlas?
-Joseph Kerski, Esri Education Manager
You must be a registered user to add a comment. If you've already registered, sign in. Otherwise, register and sign in.
About the Author
I believe that spatial thinking can transform education and society through the application of Geographic Information Systems for instruction, research, administration, and policy.
I hold 3 degrees in Geography, have served at NOAA, the US Census Bureau, and USGS as a cartographer and geographer, and teach a variety of F2F (Face to Face) (including T3G) and online courses. I have authored a variety of books and textbooks about the environment, STEM, GIS, and education. These include "Interpreting Our World", "Essentials of the Environment", "Tribal GIS", "The GIS Guide to Public Domain Data", "International Perspectives on Teaching and Learning with GIS In Secondary Education", "Spatial Mathematics" and others. I write for 2 blogs, 2 monthly podcasts, and a variety of journals, and have created over 5,000 videos on the Our Earth YouTube channel.
Yet, as time passes, the more I realize my own limitations and that this is a lifelong learning endeavor and thus I actively seek mentors and collaborators.
Labels
-
Administration
38 -
Announcements
44 -
Career & Tech Ed
1 -
Curriculum-Learning Resources
178 -
Education Facilities
24 -
Events
47 -
GeoInquiries
1 -
Higher Education
518 -
Informal Education
265 -
Licensing Best Practices
46 -
National Geographic MapMaker
10 -
Pedagogy and Education Theory
187 -
Schools (K - 12)
282 -
Schools (K-12)
184 -
Spatial data
24 -
STEM
3 -
Students - Higher Education
231 -
Students - K-12 Schools
85 -
Success Stories
22 -
TeacherDesk
1 -
Tech Tips
83
- « Previous
- Next »