Turn on suggestions
Auto-suggest helps you quickly narrow down your search results by suggesting possible matches as you type.
Cancel
- Home
- :
- All Communities
- :
- Industries
- :
- Education
- :
- Education Blog
- :
- Analyzing Change Over Time Using Topographic Maps ...
Analyzing Change Over Time Using Topographic Maps and Imagery with GIS
Subscribe
1635
0
06-29-2017 12:14 AM
- Subscribe to RSS Feed
- Mark as New
- Mark as Read
- Bookmark
- Subscribe
- Printer Friendly Page
- Report Inappropriate Content
06-29-2017
12:14 AM
A principal aim of geospatial analysis is examining and understanding change over space and time. One of the simplest yet most powerful things you can do in ArcGIS desktop (www.esri.com/arcgis) or in ArcGIS Online (www.arcgis.com) is to visualize change over time by studying change based on different basemaps created on different dates.
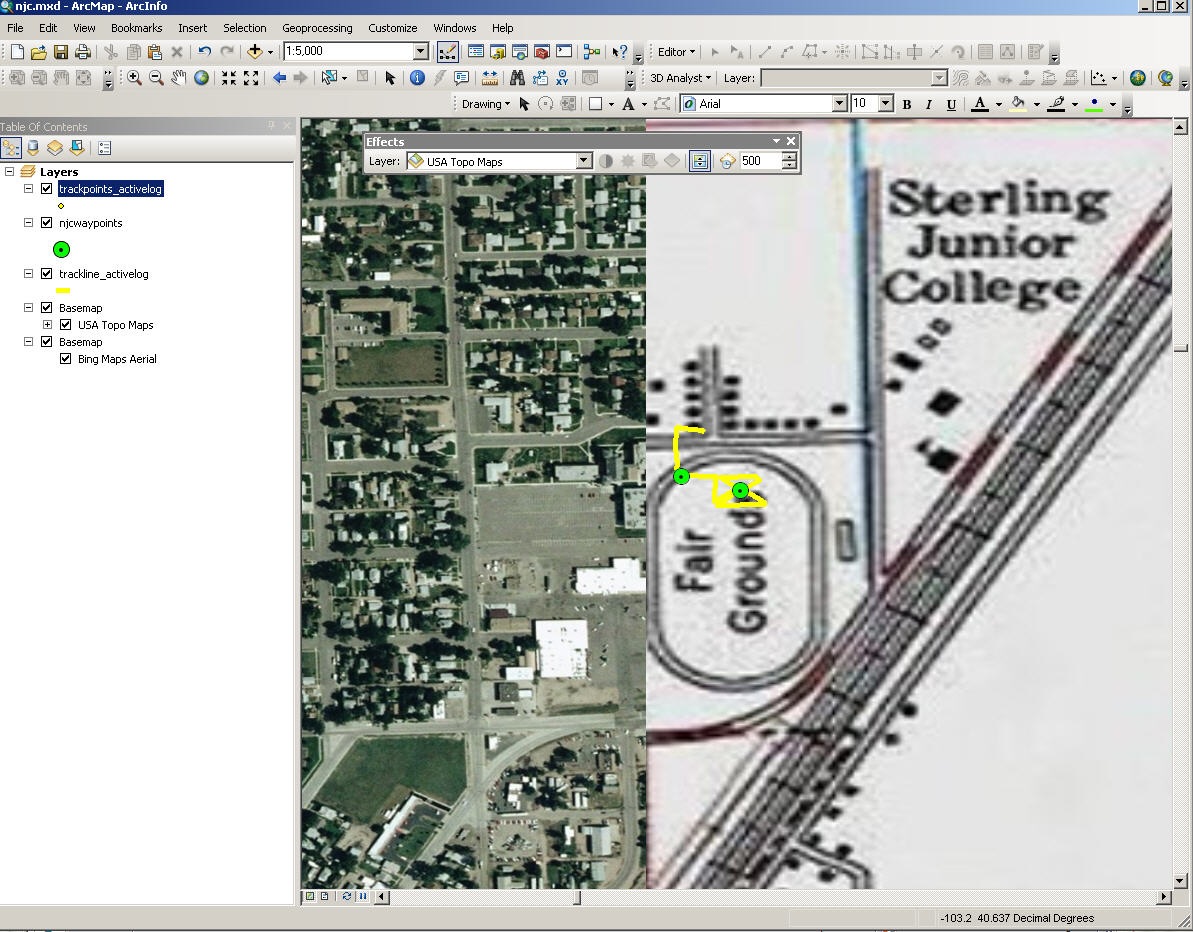
For example, I recently conducted a GIS workshop for educators at Northeast Junior College in Sterling, Colorado. While on campus, in ArcMap, I added satellite imagery as well as the USGS topographic map. I determined the date of the topographic map (1971) by accessing the USGS Map Store. I found the date of the satellite imagery (2009) by using the Identify tool in ArcMap on the imagery layer. I used the swipe tool so I could scroll back and forth across the map to easily compare the different basemap images.
The nearly 40 years of changes revealed by comparing the topographic map to the satellite imagery indicated that the name and the location of the college had changed. The college had changed from Sterling Junior College to Northeastern Junior College, and had expanded from the northeast to the southwest. The current location of the college is the former Logan County fairgrounds. After mapping the route we took during our fieldwork with GPS receivers that day (shown in dark yellow on the map below), we discovered that we were on the old fairgrounds track. We could trace the fairgrounds track and then walk that same route on the current campus, noting what had changed.
Comparing the two basemaps revealed changes beyond the campus, including the direction that Sterling had expanded over the decades, the expansion of commercial zoning into former residential areas, and even the renumbering of the interstate from I-80S to I-76. In ArcMap, we measured the areal extent of the city in 1971 and today, compared the percentage of expansion to other communities in the area and other communities of a similar size in the region, and examined population data of these communities.
How might you analyze change over time using topographic maps and imagery of an area you are interested in?
-Joseph Kerski, Education Manager
You must be a registered user to add a comment. If you've already registered, sign in. Otherwise, register and sign in.
About the Author
I believe that spatial thinking can transform education and society through the application of Geographic Information Systems for instruction, research, administration, and policy.
I hold 3 degrees in Geography, have served at NOAA, the US Census Bureau, and USGS as a cartographer and geographer, and teach a variety of F2F (Face to Face) (including T3G) and online courses. I have authored a variety of books and textbooks about the environment, STEM, GIS, and education. These include "Interpreting Our World", "Essentials of the Environment", "Tribal GIS", "The GIS Guide to Public Domain Data", "International Perspectives on Teaching and Learning with GIS In Secondary Education", "Spatial Mathematics" and others. I write for 2 blogs, 2 monthly podcasts, and a variety of journals, and have created over 5,000 videos on the Our Earth YouTube channel.
Yet, as time passes, the more I realize my own limitations and that this is a lifelong learning endeavor and thus I actively seek mentors and collaborators.
Labels
-
Administration
38 -
Announcements
45 -
Career & Tech Ed
1 -
Curriculum-Learning Resources
179 -
Education Facilities
24 -
Events
47 -
GeoInquiries
1 -
Higher Education
519 -
Informal Education
266 -
Licensing Best Practices
46 -
National Geographic MapMaker
17 -
Pedagogy and Education Theory
187 -
Schools (K - 12)
282 -
Schools (K-12)
185 -
Spatial data
24 -
STEM
3 -
Students - Higher Education
231 -
Students - K-12 Schools
86 -
Success Stories
22 -
TeacherDesk
1 -
Tech Tips
83
- « Previous
- Next »