Turn on suggestions
Auto-suggest helps you quickly narrow down your search results by suggesting possible matches as you type.
Cancel
- Home
- :
- All Communities
- :
- Industries
- :
- Education
- :
- Education Blog
- :
- Landsat Thematic Bands Web Mapping Application Enh...
Landsat Thematic Bands Web Mapping Application Enhancement
Subscribe
510
0
09-22-2016 10:59 PM
- Subscribe to RSS Feed
- Mark as New
- Mark as Read
- Bookmark
- Subscribe
- Printer Friendly Page
- Report Inappropriate Content
09-22-2016
10:59 PM
Not long ago, I described the Landsat Thematic Bands Web Mapping Application, an easy-to-use but powerful teaching and research tool. It is a web mapping application with global coverage, with mapping services updated daily with new Landsat 8 scenes and access to selected bands that allows the user to visualize agriculture, rock formations, vegetation health, and more. The Time tool allows for the examination of changes over years, over seasons, or before and after an event. The Identify tool gives a spectral profile about each scene. I have used this application dozens of times over the past year in remote sensing, geography, GIS, and other courses and workshops, and judging from the thousands of views that this blog has had, many others have done the same thing.
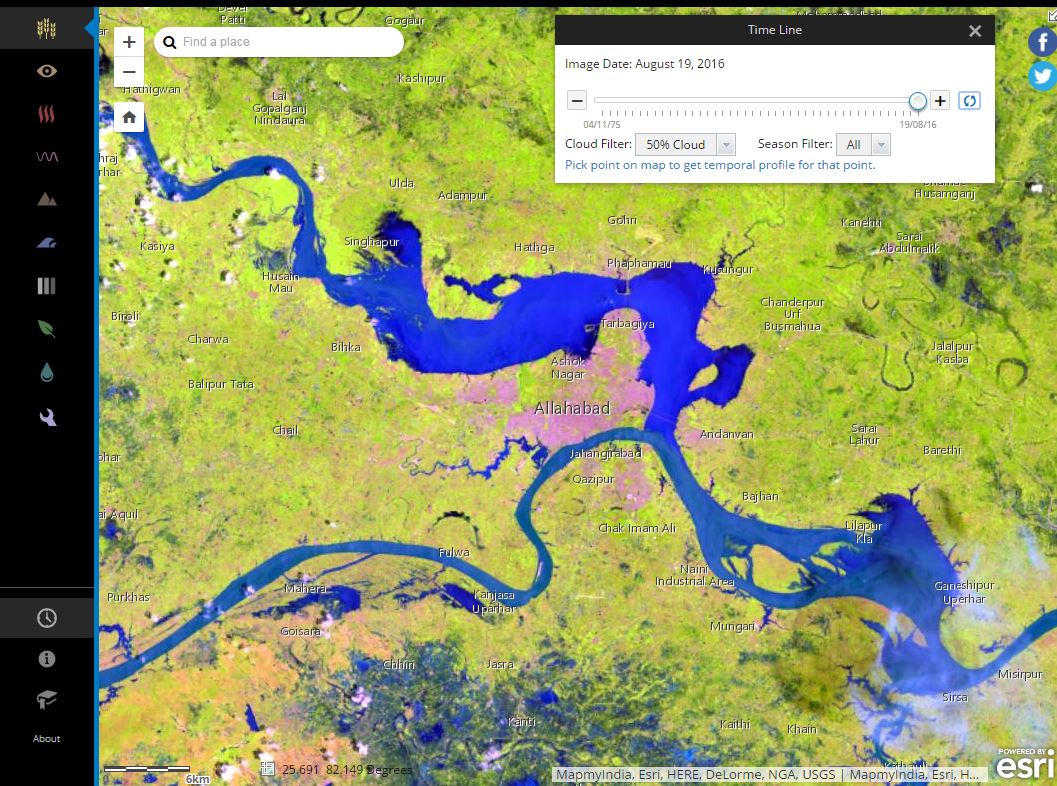
If that weren't all, our Esri development team has recently made the tool even better--one can now save a time sequence or a band combination as a permanent URL that can be shared with others. The flooding of 20 districts in August and September 2016 in Uttar Pradesh, India, for example, can be easily seen on this link that uses the application, with screenshots below.
Another example is the 2016 Fort McMurray wildfire in Alberta, Canada - the user can change the time to see the region's vegetation cover before and after fire, and the extent of the smoke during the fire. Or, you can analyze a different band combination, as is seen here.
To do this, open the application. Note that this application's URL has been updated over the one I referred to last year. Move to an area of interest. Select any one of the available thematic band renderers (such as agriculture, natural color, color infrared, and so on), or create your own band combination using build. Then, turn on "time" to see your area of interest at different periods using your band combination. Next, share this image with other people. Simply click on any one of the social platforms (Facebook or Twitter) in the upper right, which will create a short link that can be shared. When the person you send this link to opens it, the Landsat app will open in exactly the same state it was in before social platform tool was clicked. This makes it a very convenient teaching, presentation, and research tool. Give it a try!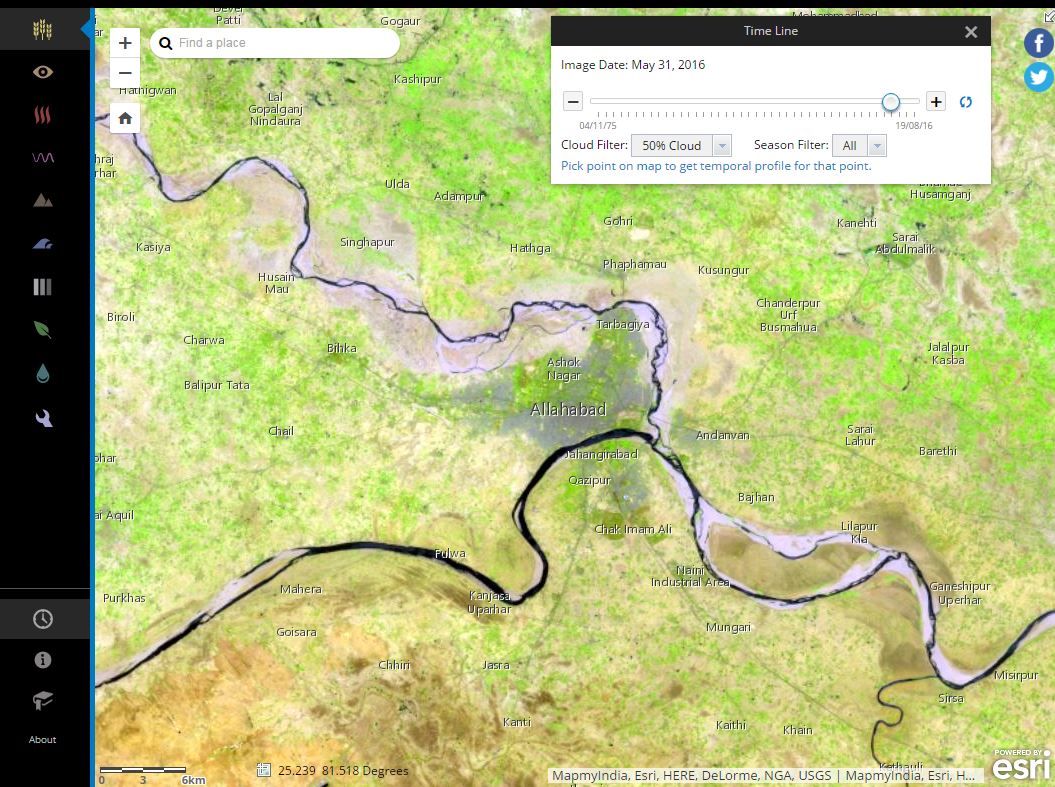

Landsat 8 Image for Allahabad India on 31 May 2016.

Landsat 8 Image for Allahabad India showing flooding on 19 August 2016.
You must be a registered user to add a comment. If you've already registered, sign in. Otherwise, register and sign in.
About the Author
I believe that spatial thinking can transform education and society through the application of Geographic Information Systems for instruction, research, administration, and policy.
I hold 3 degrees in Geography, have served at NOAA, the US Census Bureau, and USGS as a cartographer and geographer, and teach a variety of F2F (Face to Face) (including T3G) and online courses. I have authored a variety of books and textbooks about the environment, STEM, GIS, and education. These include "Interpreting Our World", "Essentials of the Environment", "Tribal GIS", "The GIS Guide to Public Domain Data", "International Perspectives on Teaching and Learning with GIS In Secondary Education", "Spatial Mathematics" and others. I write for 2 blogs, 2 monthly podcasts, and a variety of journals, and have created over 5,000 videos on the Our Earth YouTube channel.
Yet, as time passes, the more I realize my own limitations and that this is a lifelong learning endeavor and thus I actively seek mentors and collaborators.
Labels
-
Administration
38 -
Announcements
44 -
Career & Tech Ed
1 -
Curriculum-Learning Resources
178 -
Education Facilities
24 -
Events
47 -
GeoInquiries
1 -
Higher Education
518 -
Informal Education
265 -
Licensing Best Practices
46 -
National Geographic MapMaker
10 -
Pedagogy and Education Theory
187 -
Schools (K - 12)
282 -
Schools (K-12)
184 -
Spatial data
24 -
STEM
3 -
Students - Higher Education
231 -
Students - K-12 Schools
85 -
Success Stories
22 -
TeacherDesk
1 -
Tech Tips
83
- « Previous
- Next »