Turn on suggestions
Auto-suggest helps you quickly narrow down your search results by suggesting possible matches as you type.
Cancel
- Home
- :
- All Communities
- :
- Industries
- :
- Education
- :
- Education Blog
- :
- Maps as representations of reality: The deciduous-...
Maps as representations of reality: The deciduous-coniferous tree “line”
Subscribe
909
0
02-19-2015 10:59 PM
- Subscribe to RSS Feed
- Mark as New
- Mark as Read
- Bookmark
- Subscribe
- Printer Friendly Page
- Report Inappropriate Content
02-19-2015
10:59 PM
One theme that we frequently discuss in teaching and learning with GIS is that maps are representations of reality. To be sure, they are very useful representations of reality, but they are representations nonetheless, laden with meaning, different possibilities for interpretation, and yes, some distortions and error. In the fast-paced world that GIS analysis and creating maps has become, it is easy to lose sight of these representation fundamentals when we have maps and imagery at our fingertips, at multiple scales and over multiple themes.In a video, I discuss just one place where care needs to be made in interpreting maps. In the video, observe my surroundings as I stand near the traditional “line” that divides the deciduous forest to the south from the coniferous forest to the north in North America. On most maps, this is indeed shown as a line. However, consider the following: Is the “line” really a line at all, or is it better described as a gradual change from deciduous to coniferous as one travels north? Is that vector line then better symbolized as a “zone”, or is vegetation better mapped as a raster data set, with each cell representing the percentage of deciduous and coniferous trees in that cell?
How many other data sets do we tend to see as having firm boundaries, when the boundaries in reality are far from being "firm"? How does that affect the decisions we make with them? Even the boundary between wetlands and open water were originally interpreted based on land cover data or a satellite or aerial image. In another example, as stated in the GIS and Public Domain Data book, contour lines are not surveyed lines, but rather are interpreted, often from aerial stereo pairs. And each data set that we can analyze with maps was collected at a specific scale, with certain equipment and software, at a specific date, and within certain margins of error that the organization established.
Maps are representations of reality. They are some of the most useful tools ever invented, but care needs to be taken when using this or any abstracted data. How might you be able to use these examples and considerations for "teachable moments" in your own instruction to foster critical thinking?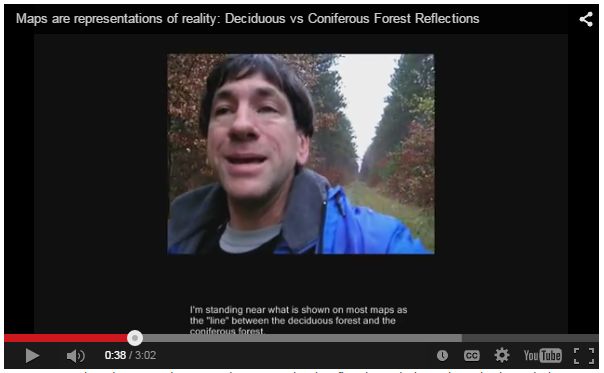
Maps as representations of reality: The deciduous-coniferous tree "line".
You must be a registered user to add a comment. If you've already registered, sign in. Otherwise, register and sign in.
About the Author
I believe that spatial thinking can transform education and society through the application of Geographic Information Systems for instruction, research, administration, and policy.
I hold 3 degrees in Geography, have served at NOAA, the US Census Bureau, and USGS as a cartographer and geographer, and teach a variety of F2F (Face to Face) (including T3G) and online courses. I have authored a variety of books and textbooks about the environment, STEM, GIS, and education. These include "Interpreting Our World", "Essentials of the Environment", "Tribal GIS", "The GIS Guide to Public Domain Data", "International Perspectives on Teaching and Learning with GIS In Secondary Education", "Spatial Mathematics" and others. I write for 2 blogs, 2 monthly podcasts, and a variety of journals, and have created over 5,000 videos on the Our Earth YouTube channel.
Yet, as time passes, the more I realize my own limitations and that this is a lifelong learning endeavor and thus I actively seek mentors and collaborators.
Labels
-
Administration
38 -
Announcements
44 -
Career & Tech Ed
1 -
Curriculum-Learning Resources
178 -
Education Facilities
24 -
Events
47 -
GeoInquiries
1 -
Higher Education
518 -
Informal Education
265 -
Licensing Best Practices
46 -
National Geographic MapMaker
10 -
Pedagogy and Education Theory
187 -
Schools (K - 12)
282 -
Schools (K-12)
184 -
Spatial data
24 -
STEM
3 -
Students - Higher Education
231 -
Students - K-12 Schools
85 -
Success Stories
22 -
TeacherDesk
1 -
Tech Tips
83
- « Previous
- Next »