Turn on suggestions
Auto-suggest helps you quickly narrow down your search results by suggesting possible matches as you type.
Cancel
- Home
- :
- All Communities
- :
- Industries
- :
- Education
- :
- Education Blog
- :
- Investigating Extreme Temperatures Using ArcGIS On...
Investigating Extreme Temperatures Using ArcGIS Online
Subscribe
415
0
09-07-2012 12:15 AM
- Subscribe to RSS Feed
- Mark as New
- Mark as Read
- Bookmark
- Subscribe
- Printer Friendly Page
- Report Inappropriate Content
09-07-2012
12:15 AM
Who has ever looked in the newspaper or online and read that day’s extreme high and low temperatures for your country or for the world? Who has ever wanted to map that data? I thought so! Three years ago, I did exactly that when I created a data set and lesson on extreme daily temperatures for ArcGIS for the USA, which I updated last month for ArcGIS 10. But I also have just created a version for ArcGIS Online, which was easy to do given ArcGIS Online’s geocoding capabilities, and the lesson provide a pathway to spatial analysis with a fascinating data set.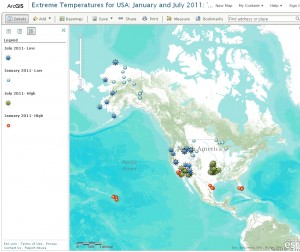
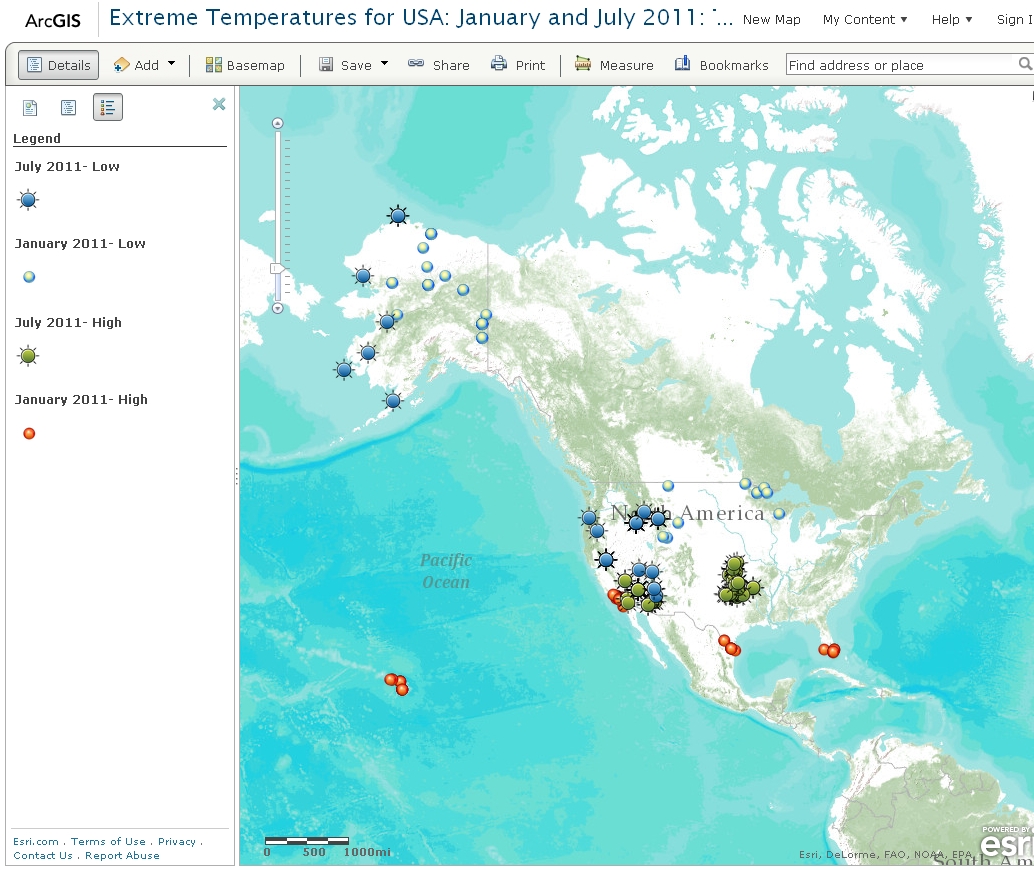
What is the relationship of temperature extremes to latitude, altitude, seasons, and proximity to coasts? Previous experience with GIS is not necessary to use this lesson, but the geographic perspective is important. Ideally, this lesson would be run during a unit on climate and weather. Data layers include extreme temperatures, a topographic map, and cultural features. The temperature data was gathered with the help of a stellar secondary school student. The map shows the locations of all of the places that recorded a high or low temperature extreme in the USA for each of the 31 days in January 2011 and the 31 days in July 2011. For example, on 15 January, the high temperature in the USA occurred in Santa Ana, California, and the low temperature on that date occurred in Northway, Alaska, and in Chicken, Alaska. Therefore, Santa Ana, Northway, and Chicken all are symbolized appropriately on this map.
As expected, the January highs are mostly in the low latitudes and near coasts, such as Hawaii, southern California, Texas, and Florida, but by July have migrated inland to Arizona, Nevada, and Oklahoma, reflecting the southern plains heat wave that year. The January lows occur in the high latitudes of Minnesota, Montana, and Alaska. By July, some remain in Alaska but others migrate to high altitudes in Montana, Oregon, Colorado, and even as far south as Arizona.
I couldn’t stop there, because another data set just aching to be mapped were the historical high and low temperature extremes for each state. I have now also mapped these in ArcGIS Online and packaged with a lesson. This map shows the locations where the all-time low and high temperature occurred in each state, dating back to the late 1800s. As such, fascinating patterns in space and time are visible, such as record highs from the Dust Bowl years that still stand today, and the effects of latitude, altitude, and proximity to coasts. Both of these data sets and lessons could find good homes in climatology, meteorology, and geography courses, but also in mathematics courses and in the last example, in a history course. Feel free to modify either lesson with your own questions.
How might you be able to use these resources in your courses?
- Joseph Kerski, Esri Education Manager
You must be a registered user to add a comment. If you've already registered, sign in. Otherwise, register and sign in.
About the Author
I believe that spatial thinking can transform education and society through the application of Geographic Information Systems for instruction, research, administration, and policy.
I hold 3 degrees in Geography, have served at NOAA, the US Census Bureau, and USGS as a cartographer and geographer, and teach a variety of F2F (Face to Face) (including T3G) and online courses. I have authored a variety of books and textbooks about the environment, STEM, GIS, and education. These include "Interpreting Our World", "Essentials of the Environment", "Tribal GIS", "The GIS Guide to Public Domain Data", "International Perspectives on Teaching and Learning with GIS In Secondary Education", "Spatial Mathematics" and others. I write for 2 blogs, 2 monthly podcasts, and a variety of journals, and have created over 5,000 videos on the Our Earth YouTube channel.
Yet, as time passes, the more I realize my own limitations and that this is a lifelong learning endeavor and thus I actively seek mentors and collaborators.
Labels
-
Administration
38 -
Announcements
45 -
Career & Tech Ed
1 -
Curriculum-Learning Resources
179 -
Education Facilities
24 -
Events
47 -
GeoInquiries
1 -
Higher Education
519 -
Informal Education
266 -
Licensing Best Practices
46 -
National Geographic MapMaker
11 -
Pedagogy and Education Theory
187 -
Schools (K - 12)
282 -
Schools (K-12)
185 -
Spatial data
24 -
STEM
3 -
Students - Higher Education
231 -
Students - K-12 Schools
86 -
Success Stories
22 -
TeacherDesk
1 -
Tech Tips
83
- « Previous
- Next »